
Here's some information on weather models on the net, which members might find useful for predicting future weather conditions.
The predictions show model runs which are updated ever few hours with forecasts for several days hence, so anything more than 2-3 days in the future should be treated with caution.
One of the main weather sites is at http://www.wetterzentrale.de/topkarten/
On the top left hand side, click on GFS then select the "850hPa Temperatur" link to see temperature maps for approximately 1500m altitude, or "Niederschlag" for the precipitation maps. (Use the 6-hour interval links to see the model predictions).
A neat display is the "Animator-Panel" link (third row on the right) - where it has dropdown boxes saying "bitte wahlen", select "850hPa temperature" in the first one & "Niederschlag" in the second, and it will download the image maps for the next week, and you can then animate the corresponding temperature & precip. maps by dragging the cursor over the time intervals on the left.
Other useful models are the ECMWF link - select the "SLP, 850 hPa Wind (ECMWF)" link and it gives maps showing the likely wind strengths at 1500m
Selecting the FAX link, has options for more conventional weather charts - a neat one is the USAF Sembach link, which has some reasonable graphics for pressure, cloud cover & precipitation.
Wetterzentrale also has temperature & precipitation prediction charts for locations across Europe where latitude and longitude are whole numbers - scroll down further for examples/explanation

so http://www.wzkarten.de/pics/MS_745_ens.png , is lat 45.00 degrees North, long 7.00 degrees East, which turns out to just to the NE of Sestriere.
You can change the numeric part of the URL to select the predicition for the area you are interested in. Here are some examples:
7 - 46 is on the Swiss French border above Argentiere
6 - 45 is on the edge of the Ecrins park a few km West of L2A
8 - 46 is on the Swiss Italian border near Saas Fee
All of these are approximate locations, and 850hPa pressure is for a height equivalent to around 1,500m ....
http://www.wzkarten.de/pics/MS_-457_ens.png - Scotland - a few miles SE of Newtonmore/Kingussie
http://www.wzkarten.de/pics/MS_1147_ens.png - Garmisch Partenkirchen/Seefeld/Ehrwald
http://www.wzkarten.de/pics/MS_1047_ens.png - Lech/Zurs/St. Anton/Ischgl
http://www.wzkarten.de/pics/MS_1347_ens.png - Kitzbuhel/Bad Gastein/Skiwelt
http://www.wzkarten.de/pics/MS_1146_ens.png - Madonna di Campiglio
http://www.wzkarten.de/pics/MS_846_ens.png - Saas Fe/Monte Rosa/Zermatt/Cervinia
http://www.wzkarten.de/pics/MS_744_ens.png - Isola 2000/Auron
http://www.wzkarten.de/pics/MS_746_ens.png - Morzine / Les Gets / Avoriaz
There are two sets of lines in these forecast graphs....
The top set (left hand axis in deg C) represents temperatures at 850 Hpa. (approx 1500m)
There are quite a few lines, corresponding to model runs with different parameters. The closer together they are, the more certain the prediction.
The thick red line is the 30-year average.
The thick blue line is the most probable model run (and is the one seen in maps)
The grey line is the average of all the model runs (and is the one seen on ENS model maps)
The lower set of lines represents precipitation (right hand axis in cm), following the same arrangement as the temperatures. The total precipitation at a given location is proportional to the area bounded by each line.
One can say that, the further off in time, the less probable a prediction is.
Also valuable are the "Meteograms" which take the average of the model runs, and produce a chart for the week showing cloud cover (cross section through the sky at high, middle & low levels), pressure, wind speed & direction, max & min temperature and precipitation
This chart is 46N 7.5E which is around the Arolla area http://www.wzkarten.de/pics/MS_075460_g05.png
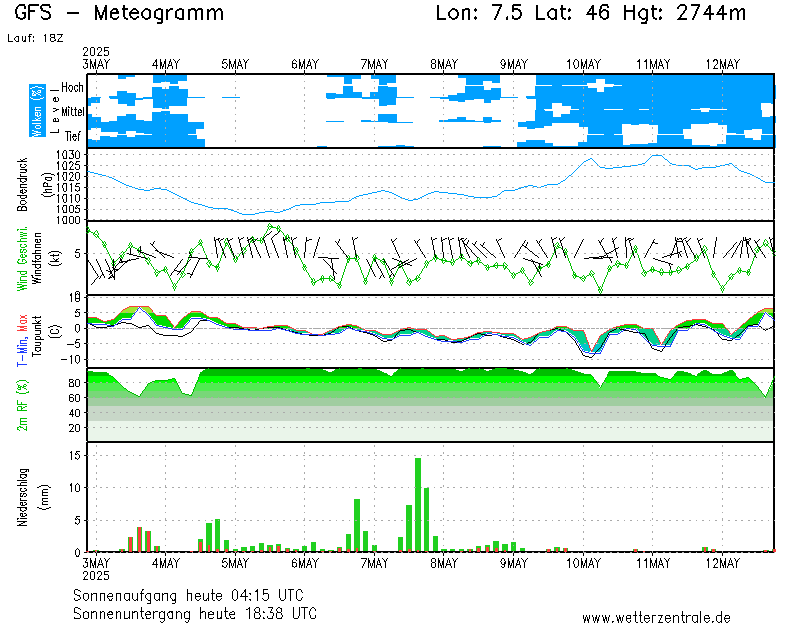
Again, you can play around changing the lat & long values, to get the area you are interested in - a useful technique when trying to work out the lat & long of locations if you don't have a map to hand, is to put the coordinates into Google maps in decimal degrees ie 46,7.5 which is about 3km SE of Arolla
eg http://www.wzkarten.de/pics/MS_110470_g05.png is near Sőlden (11E, 47N) etc..
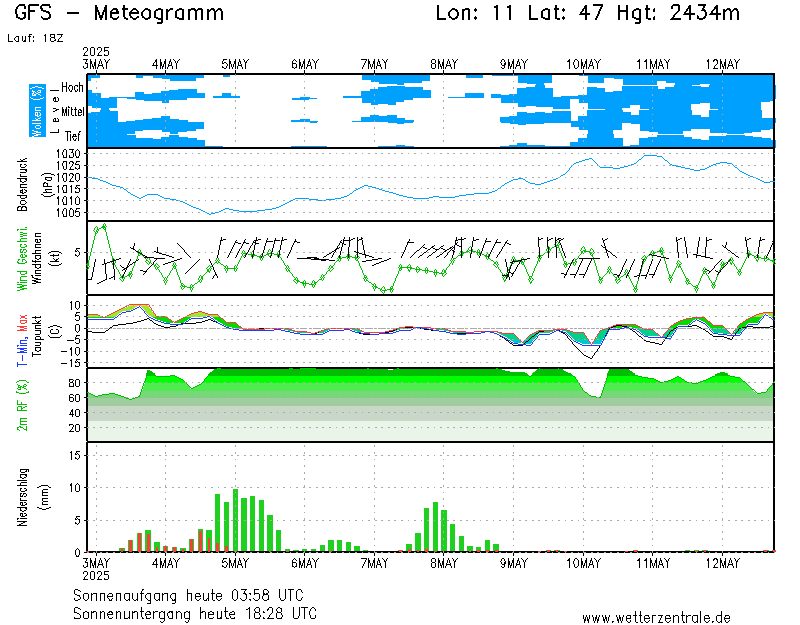